The graph displays the average order shipping time. How many days passed from placing an order to shipping one?
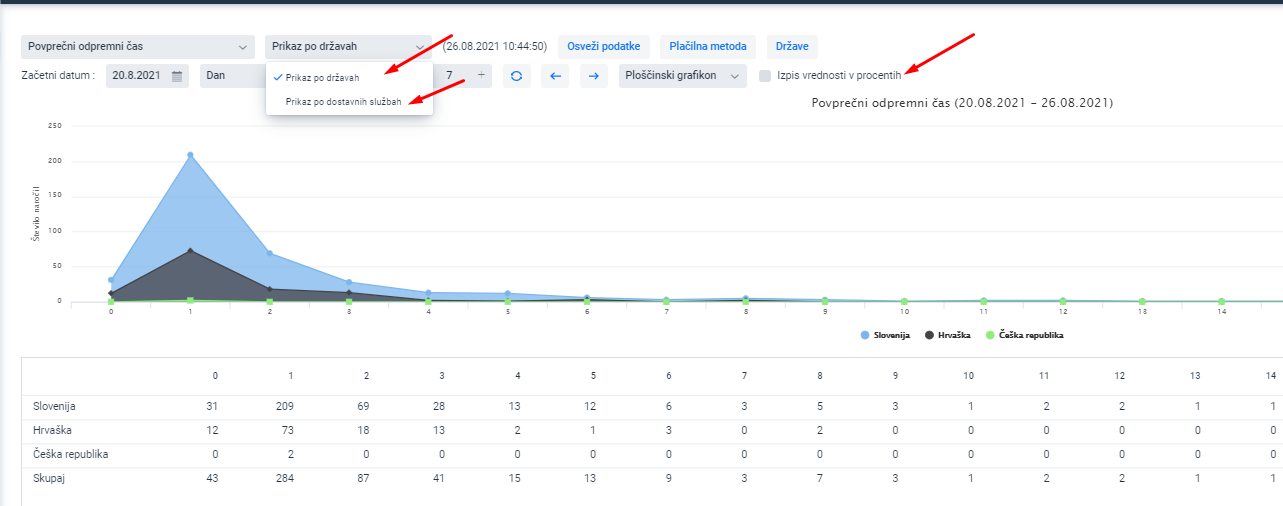
From the graph, it is possible to find out how many orders were shipped in the selected period on the same day when such were ordered, how many of them were shipped the next day, and how many in 2 or 3 days.
Display by countries or delivery services is available:
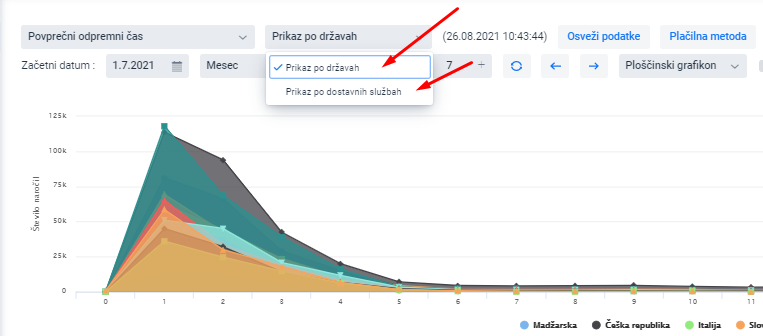
Data can be filtered by individual payment method or country while it can also be displayed in percentages.
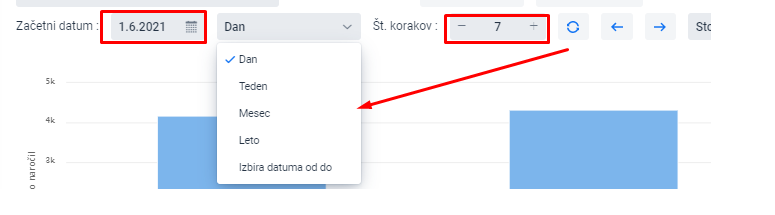
When selecting the period, set the initial date, select the display by day, week, month, or year, or select the time frame for display from, to. When selecting the number of steps, select for how many days, weeks, and months...graph should be drawn based on the selected initial date.
Was this article helpful?
That’s Great!
Thank you for your feedback
Sorry! We couldn't be helpful
Thank you for your feedback
Feedback sent
We appreciate your effort and will try to fix the article