
Analytics
Graph - Delivery events and package acceptance
This article is not available in Polish, view it in Slovenian
The graph displays the ending outcome for the package depending on the different delivery scenarios
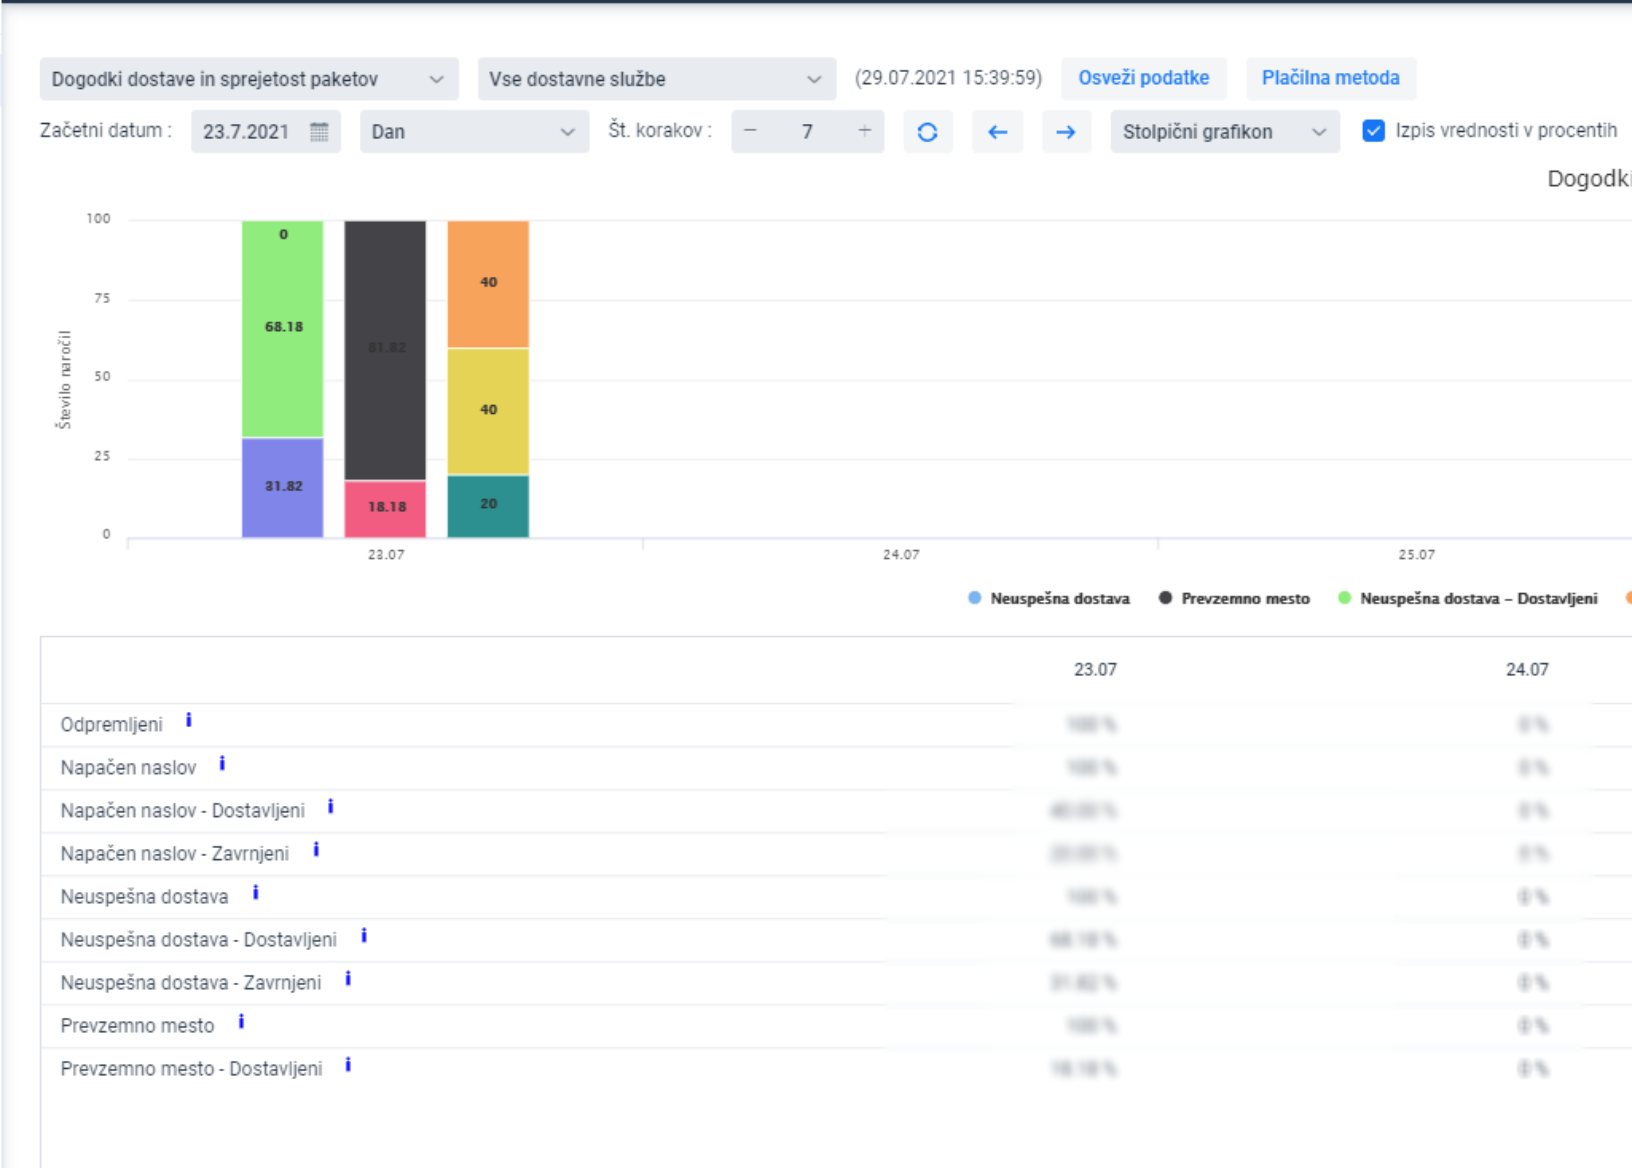
EXAMPLE: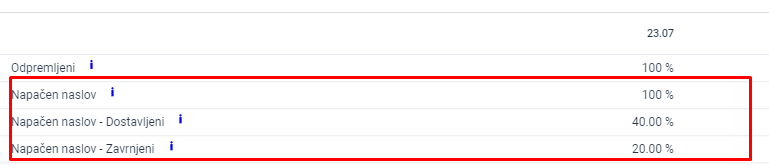
For a certain amount of orders, the delivery address was incorrect, which in this case represents 100% of orders. 40% of orders with a wrong address were successfully delivered, while 20% of them were returned. For the remaining 40%, the outcomes are yet to be known.
To display the number of packages, turn on the display of values as percentages

Was this article helpful?
That’s Great!
Thank you for your feedback
Sorry! We couldn't be helpful
Thank you for your feedback
Feedback sent
We appreciate your effort and will try to fix the article