
Chart - Order counter
The chart shows the average times from placing the order to acceptance at the depot, and the packing time:
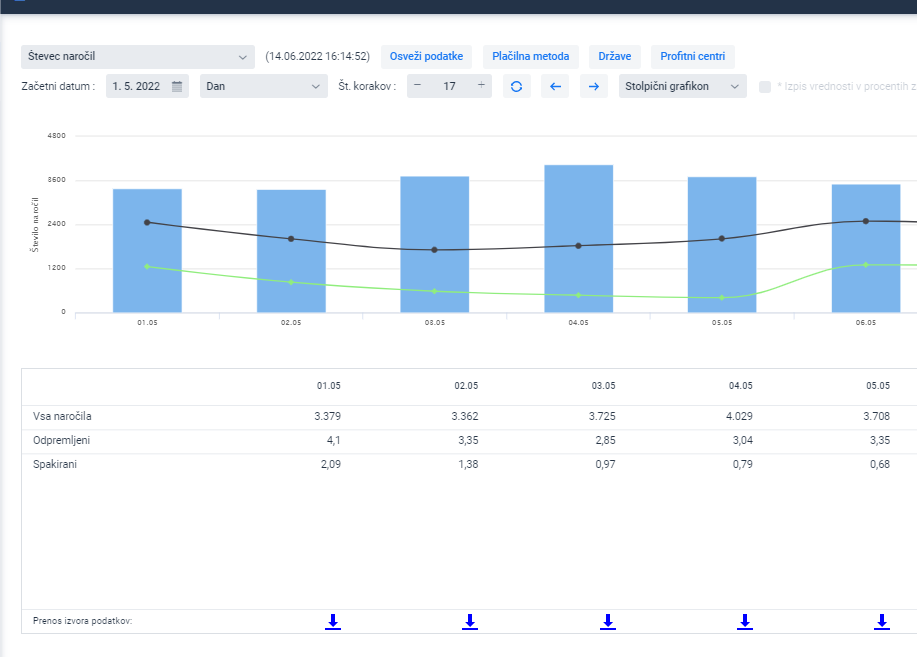
The chart contains 3 values:
ALL ORDERS: orders recorded in Order Management on the selected date
SHIPPED: average time from placing the order on the selected date to acceptance at the depot
PACKED: average time from placing the order on the selected date to the time the order is packed
Example: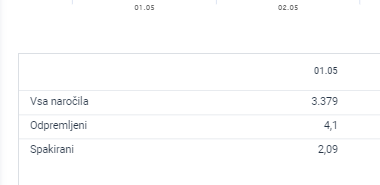
On 1 May, 3379 orders were recorded. The average packing time for these orders was 2.09 days, and the average time from placing the order to acceptance at the depot was 4.1 days
For orders that go to the Problem status, the packing time and shipping time are counted from the date the order returned to the NEW status
Was this article helpful?
That’s Great!
Thank you for your feedback
Sorry! We couldn't be helpful
Thank you for your feedback
Feedback sent
We appreciate your effort and will try to fix the article